369 Trading Room
How to Read the US30 Live Chart Like a Pro
Charts look like noise until you know what to look for. This guide breaks down candles, trend, volume, and key levels so the US30 live chart finally starts making sense.
Why Chart Reading Beats Guessing
Plenty of traders stare at a US30 chart and see nothing but random zigzags. Once you know what each element is actually telling you, the same chart starts to feel far less chaotic and far more like a conversation between buyers and sellers.
Learning to read price action is not about memorizing dozens of indicators. It is about understanding a handful of core building blocks well enough that you can look at the Dow Jones chart and form an opinion without needing someone else to tell you what to think.
This matters for both new and experienced traders. Beginners often assume chart reading requires years of study, while more experienced traders sometimes lean too heavily on indicators and forget the raw price story underneath them. Both groups tend to benefit from returning to the basics covered in this guide, since the fundamentals rarely go out of style even as tools and platforms change.
The Building Blocks of a US30 Live Chart
Before diving into patterns, it helps to understand the raw material every chart is built from. A few core elements show up on nearly every chart you will ever look at.
Let's break down all four of these a little further.


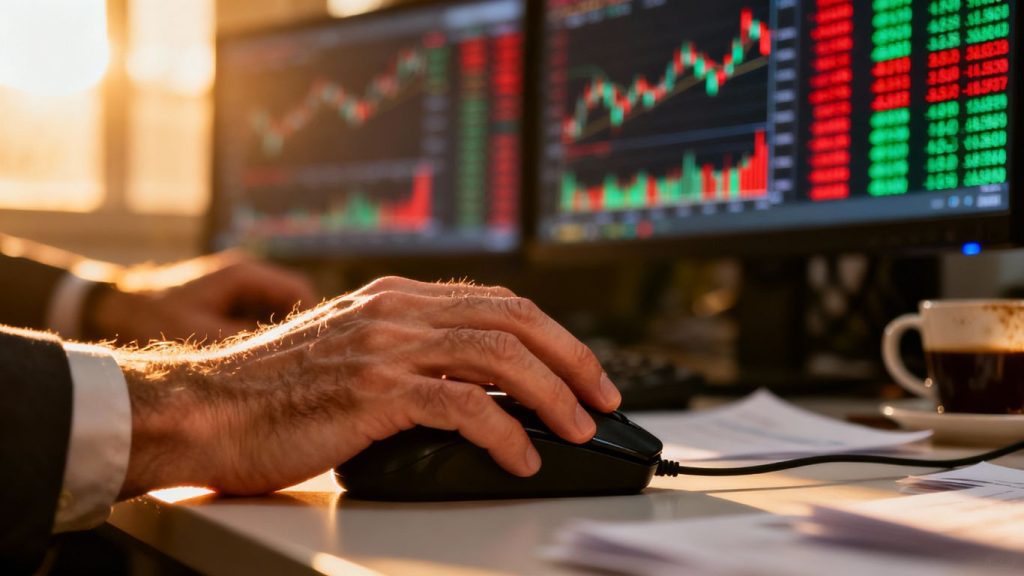
The more times a zone has been tested, the more significance traders tend to give it, though even well respected levels eventually break once enough pressure builds behind them. When a level does finally give way, it often flips roles, turning old resistance into new support or the reverse, which is worth watching for on the next pullback.
Reading the US30 Analysis Timeframes That Matter
Different timeframes tell different stories, and mixing them up is one of the fastest ways to get confused about what a chart is actually showing you.
The Daily Chart Sets the Big Picture
Zooming out to the daily chart shows the broader trend and major structural levels that shorter timeframes often miss entirely. Many experienced traders check this view first before ever looking at anything smaller.
The Hourly Chart Shows Session Structure
Dropping down to an hourly view reveals how price behaves within a single trading day, including where momentum tends to build or stall around specific hours of the session.
Lower Timeframes Refine Your Entry
Once the bigger picture is clear, a five or fifteen minute chart helps fine tune exact entry points. Using this timeframe without first checking the bigger picture is a common mistake that leads to trading against the larger trend.
Some traders skip the middle step entirely, jumping straight from the daily view to a very short timeframe. This often means missing the session context that the hourly chart provides, which can make an otherwise reasonable entry feel far riskier than it needs to.
Common Chart Patterns Worth Knowing
A handful of recurring shapes tend to show up again and again on the chart, and recognizing them early can sharpen your read on where price might head next.
Double Tops and Double Bottoms
These form when price tests a level twice and fails to push through, suggesting the opposing side has stepped in with enough force to hold the line. Confirmation usually comes once price breaks the level between the two peaks or troughs.
Head and Shoulders Formations
This pattern shows three pushes, with the middle one being the highest or lowest, hinting that momentum is fading. Traders often wait for a clean break of the neckline before treating the pattern as confirmed rather than acting early.
Flags and Pennants
These small consolidations after a strong move often continue in the same direction once they resolve. They tend to be brief, which makes patience important since jumping in too early can mean sitting through extra chop.
Triangles Before a Breakout
Price compresses into a tightening range as buyers and sellers reach a temporary standoff. Volume often shrinks during the triangle itself, then expands sharply once price finally breaks free in one direction.
Mistakes That Distort Your Reading
Even traders who understand the theory can misread a US30 chart if a few habits go unchecked.
According to FINRA's day trading rules, an account must maintain a minimum equity of twenty five thousand dollars to continue day trading once it is flagged as a pattern day trader, a reminder that chart reading skill alone does not remove the practical account requirements tied to frequent intraday trading. Understanding both the technical picture and the rules governing your account keeps surprises from derailing an otherwise solid read on price.
This rule specifically applies to certain margin accounts placing frequent trades, so the details can vary depending on how an account is structured. Checking with your own broker about which rules apply to your account is worth doing early, well before the specifics matter in a live trading moment.
CME Group, which lists Dow Jones futures products, runs its Globex platform nearly around the clock, opening Sunday evening and running through Friday afternoon Central Time with only brief daily maintenance breaks. Knowing when the market you are charting is actually open, and when thinner overnight liquidity might distort what you are seeing, matters just as much as any pattern on the screen.
Candles that form during quieter overnight hours can look dramatic on a short timeframe chart while actually reflecting very little real participation. Recognizing the difference between a genuine session move and a thin, low volume drift is a skill that develops with time spent watching how the chart behaves across different hours of the day.
Practicing Until It Becomes Second Nature
Reading a US30 live chart fluently takes repetition, not a single afternoon of study. Here is a sensible way to build that fluency over time, so studying it daily becomes a habit rather than an occasional exercise.
Most traders underestimate how many hours of screen time it actually takes before pattern recognition starts to feel automatic. There is no shortcut around this, though a structured routine can make the repetition far more productive than aimless scrolling through charts.
Watching Chart Reading Applied in Real Time
Textbook patterns look clean in hindsight, but real charts rarely play out as neatly as the examples in a guide. Watching someone experienced narrate price action as it forms is often the fastest way to close that gap.
Inside our community, members watch how the 369 Day Trading Framework is used to interpret US30 analysis during real sessions, including the moments where a pattern almost confirms and then fails. You see the reasoning behind each read, then apply that same process to your own account with your own broker. The US30 Trading Service Page walks through what these live sessions actually look like.
These sessions are not scripted. Setups sometimes fail exactly as the pattern predicted they might, and watching how an experienced trader manages that outcome calmly tends to matter more than any single winning trade example. That calm, repeatable response is ultimately what separates a trader with real skill from someone who simply got lucky on a handful of trades.
Hearing someone explain why they are hesitating on a setup, not just why they took a trade that worked, tends to teach far more than any static chart example ever could. Real charts are messy, and learning to sit with that uncertainty alongside more experienced traders tends to build confidence faster than studying clean textbook examples alone.
Keep Sharpening Your US30 Live Chart Reading
Understanding candles, volume, and patterns is the foundation, but fluency comes from watching enough real charts unfold to build genuine pattern recognition.
If you want to see how experienced traders read a Dow Jones chart in real time, the US30 Trading Service Page shows exactly how our sessions are structured around live analysis. Whether you are still learning to spot a clean trendline or refining how you read volume, there is a place to practice alongside traders doing the same work. Visit the US30 Trading Service Page to see how the live sessions run and start sharpening your own eye for the chart.
Frequently Asked Questions
What is the fastest way to get better at reading a US30 live chart?
Consistent practice on historical and live charts, paired with honest notes on what you read correctly, tends to build fluency faster than studying theory alone.
Do I need indicators to read a US30 chart well?
No, many experienced traders rely mainly on price, volume, and structure, adding only one or two indicators as confirmation rather than a primary decision tool.
How is a Dow Jones chart different from a stock chart?
It reflects the combined movement of thirty companies rather than one business, so patterns often form around broader economic sentiment instead of single company news.
Which timeframe is best for US30 analysis?
Most traders check a higher timeframe for context first, then use a lower timeframe to refine entries, rather than relying on just one view alone.
Can chart patterns fail even when they look textbook perfect?
Yes, no pattern guarantees an outcome, which is why confirmation and proper risk management matter as much as correctly identifying the shape itself.
How much history should I study before trading live?
There is no fixed number, but reviewing several months of historical price action tends to build enough pattern exposure to recognize setups with more confidence.
Is volume really necessary to read price action accurately?
It is not strictly required, but ignoring volume removes an important layer of confirmation that helps separate genuine breakouts from moves likely to reverse quickly.
Same Room (New Name) - 14 Years - Best Trading Community
Read what our members have to say!
"Transformed"
In early 2015 I was searching for a second income, an extra wage to help pay the bills. I’d had a go at MLM but found all the extra work time consuming. I started looking into binary options and online trading. During the research I came across a review aobut this room. Read more...

Jas (The G.O.A.T)
Master Trader
"Can't Wait"
I have been in many, MANY things in my 40 plus years of searching for the right opportunity. Thank GOD I was lead here!! NOTHING better! GOD bless MT and for all those who help you in this room. Being personally mentored by people making millions is amazing. Price is incredibly LOW for the ROI, but don’t tell.

TK
Trader
"Delicious"
I found this class by accident. I was already doing some forex and binary when I found MT’s site. Getting texts when to buy and when to sell on forex news from the other service I was using was a complete joke. I couldn’t stand the waiting and wondering if we were getting a text or not. Read more...

BR
Master Trader
Daily Take from the Markets We Trade
Transactions Per Session
Transactions Per Hour
Our Largest Pip Value
Plus Years of Experience

11320 State Route 9, Champlain, NY 12919
1-(332) 244-9191
info@forexsignalroom.com
Live - 8:30 am - 5:00 pm EST Mon-Fri
January
Monday
January
01
1999