So, you’re looking to trade the US100, huh? It’s a wild ride, that’s for sure. This index, packed with big tech names, can move pretty fast. Understanding how its price moves and when it tends to get jumpy is pretty important if you don’t want to get caught off guard. We’ll break down some of the common patterns and times when the US100 volatility really shows up, so you can hopefully make smarter moves.
Key Takeaways
- The US100 often sees more action during the first and last hours of the trading day, and sometimes Fridays can be a bit more active too. Knowing these times can help you plan your trades better.
- Big news like company earnings reports or major economic updates can really shake up the US100 price movement. It’s smart to keep an eye on the calendar for these events.
- There are different ways to trade the US100, like scalping for quick profits in choppy markets, day trading for intraday momentum, or swing trading when the index is trending. Pick what fits you.
- Smart Money Concepts can help you spot where big players might be placing trades, looking at things like liquidity zones and market structure shifts to find potential entry points.
- Common mistakes include not paying attention to session times, using the same strategy everywhere, jumping in without a clear signal, and not managing your risk properly when the US100 volatility is high.
Understanding US100 Volatility Dynamics
Hourly and Daily Volatility Patterns
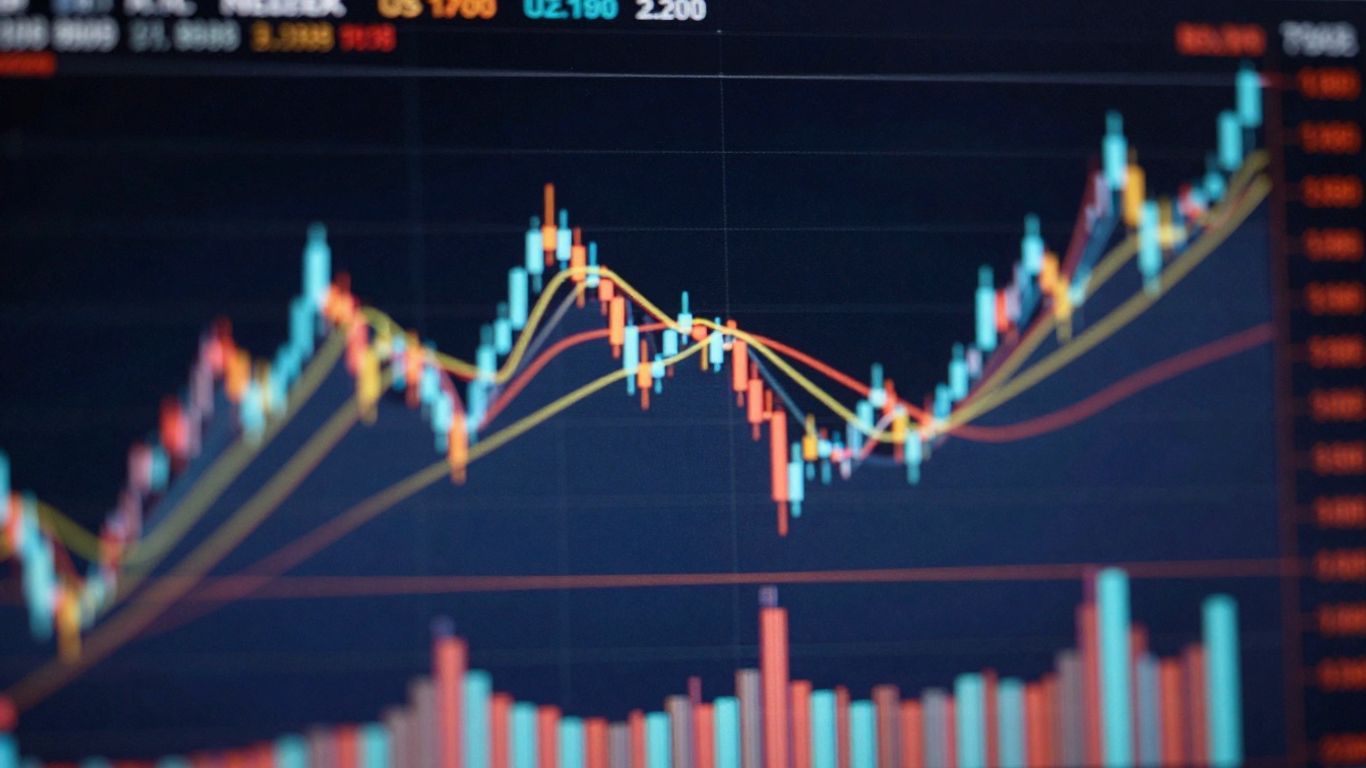
The US100, often called the Nasdaq 100, is known for its energetic price swings. If you’re into day trading, paying attention to the clock is pretty important. The first hour of trading, usually from 9:30 AM to 10:30 AM Eastern Time, tends to be quite active. This is when traders are reacting to overnight news and setting their positions for the day. You’ll often see bigger price moves during this time. The last hour, from 3:30 PM to 4:00 PM ET, can also get lively as people wrap up their trades. On a day-to-day basis, Mondays and Fridays can sometimes show larger price movements. This might be because of news that came out over the weekend or traders adjusting their portfolios before the week ends.
Weekly Swings and Event-Driven Volatility
Looking at the bigger picture, the US100 can really move during certain weeks. Think about earnings season for major tech companies or when big economic reports are released. These events tend to cause more significant ups and downs in the index. It’s not just about the regular daily patterns; specific news can really shake things up. So, while you might see a certain average daily move, be prepared for days where the index travels much further, especially when big news is on the horizon.
Average Daily Price Movement Ranges
Historically, the US100 has shown an average daily price movement that can range from about 1.5% to 2.5% of its total value. This means on a typical day, the index might move up or down within that percentage from its opening price. However, this is just an average. During times of high market stress or when major news breaks, this daily range can expand considerably. It’s a good idea to keep this variability in mind when planning your trades, as actual price action can differ from the average.
Understanding these typical price ranges helps set realistic expectations for daily trading. It’s not about predicting the exact move, but about knowing the potential scope of movement.
Key Periods Influencing Nasdaq Volatility
The Nasdaq 100, often seen as a barometer for the tech sector, doesn’t move randomly. Its price action tends to follow certain patterns, especially around specific times of the trading day and week. Understanding these rhythms can give you an edge.
The Opening Hour Frenzy
The first hour of trading, typically from 9:30 AM to 10:30 AM Eastern Time, is usually where things get lively. This is when overnight news and overnight price action get digested by the market. You’ll often see bigger price swings as traders jump in to react to whatever happened while the market was closed. It’s a period of high activity, and while it can offer opportunities, it also means higher risk.
The Closing Hour Momentum
Similarly, the last hour of trading, from about 3:30 PM to 4:00 PM Eastern Time, can also see a pickup in volatility. Traders might be adjusting their positions before the market closes for the day, or perhaps setting up trades for the next session. This can lead to some noticeable price movement as the trading day winds down.
Monday and Friday Trading Behavior
Looking at the week, Mondays and Fridays often stand out. Mondays can be influenced by weekend news and how traders are positioning themselves at the start of a new week. Fridays, on the other hand, might see adjustments as traders close out positions before the weekend. This can sometimes lead to more pronounced price swings on these specific days compared to the middle of the week.
It’s important to remember that these are general tendencies. Market conditions can change, and sometimes a quiet opening hour can be followed by a calm close, or vice versa. Always check the current market sentiment and news flow.
Here’s a quick look at typical daily ranges, though these can change:
| Period | Average Daily Range (Approx.) |
|---|---|
| Normal Day | 1.5% – 2.5% |
| High Volatility | Can exceed 3% |
This means on a typical day, the Nasdaq 100 might move within a range of 1.5% to 2.5% of its value. However, during big news events, this range can easily expand, sometimes significantly.
Navigating High-Impact Events for Tech Index Trading
Earnings Reports and Major Tech Announcements
When big tech companies drop their quarterly numbers, the US100 can really move. These aren’t just about one company; they often set the tone for the whole sector. A surprise beat on revenue or profit, or even just a hint about future growth, can send the index soaring. On the flip side, a miss or weak outlook can cause a sharp drop. It’s smart to keep an eye on the earnings calendar for companies like Apple, Microsoft, and Amazon. Knowing when these reports are due lets you prepare for potential big price swings.
Economic Data Releases and Geopolitical Tensions
Beyond company news, broader economic data and world events play a huge role. Things like inflation reports (CPI), employment figures (non-farm payrolls), or interest rate decisions from central banks can cause immediate reactions across the market. Geopolitical events, like international conflicts or major political shifts, add another layer of uncertainty. These external factors can create significant volatility, often leading to rapid price movements that traders need to be ready for.
Monetary Policy Shifts and Innovation Cycles
Changes in monetary policy, especially interest rate adjustments or quantitative easing/tightening, directly impact growth stocks that make up a large part of the Nasdaq. Higher interest rates can make future earnings less valuable, potentially pressuring the index. Conversely, looser policy can be a tailwind. Also, keep an eye on innovation cycles. Breakthroughs in AI, cloud computing, or other tech areas can boost specific companies and, by extension, the entire US100. These shifts often happen over longer periods but can create sustained trends.
Trading Strategies for US100 Price Movement
When you’re looking at the US100, or the Nasdaq 100 index, there are a few main ways traders try to make money from its price swings. It’s not a one-size-fits-all game, and what works for one person might not work for another. The key is to match the strategy to your own style, how much time you have, and how much risk you’re comfortable with. The US100 can be quite active, especially around certain times of the day and week.
Scalping in High Volatility Environments
Scalping is all about making lots of small profits from tiny price changes. Think of it like picking up pennies in front of a steamroller – you do it quickly and often. Scalpers jump in and out of trades in seconds or minutes, aiming to capture just a few points. This strategy really shines when the market is moving a lot, which the US100 often does, particularly at the start and end of the trading day. You need to have a fast connection and be ready to act instantly. It’s not for the faint of heart, as it requires intense focus and quick decisions. High liquidity is a must here, and thankfully, the Nasdaq 100 usually provides that. However, be aware that all those trades can add up in commission costs.
- Pros:
- Reduced exposure to overnight risk since positions are usually closed daily.
- Requires precision and discipline, often using strict stop-losses.
- Cons:
- High transaction costs due to frequent trading.
- Can be psychologically demanding and stressful.
- Limited profit potential per trade.
Scalping is best suited for traders who can handle fast-paced action and have the discipline to stick to their plan, even when things get hectic. It’s not a strategy for everyone, but for the right person, it can be effective in volatile markets.
Intraday Trading for Momentum Opportunities
Intraday trading, or day trading, is a bit more relaxed than scalping but still involves closing all positions before the market closes for the day. Day traders look to profit from the price movements that happen within a single trading session. They might hold a trade for a few minutes to a few hours, trying to catch bigger moves than a scalper would. This strategy works well when there’s clear momentum in the market, either up or down. You’ll want to keep an eye on the economic calendar and any major news that could cause the index to move. Understanding market structure, like identifying trends, is pretty important for this approach. It requires a good chunk of your day, as you’ll be actively monitoring the markets. This is a popular way to trade the US30, or Dow Jones Industrial Average, and similar principles apply to the US100.
- Key characteristics:
- Trades are opened and closed within the same day.
- Focuses on capturing short to medium-term price swings.
- Requires active monitoring of market conditions.
- Benefits from clear trends and momentum.
Swing Trading in Trending Markets
Swing trading is for those who prefer a less intense approach. Swing traders aim to capture price
Smart Money Concepts for Nasdaq Volatility
When we talk about "Smart Money Concepts" (SMC) in trading, we’re essentially looking at how institutional players, the big banks and hedge funds, move the market. They don’t just randomly buy and sell; they have strategies to enter and exit positions without causing massive price swings that would work against them. Understanding these concepts can give you an edge when trading the US100, especially during volatile periods.
Identifying Liquidity Zones
Liquidity is just a fancy word for where a lot of buy or sell orders are waiting. Smart Money looks for these areas because they need to fill large orders. Think of them as pools of potential trades. These zones are often found:
- Above previous session highs (where buy orders might be stacked).
- Below previous session lows (where sell orders might be waiting).
- Around significant price levels or round numbers.
- In areas where price has consolidated for a while.
These liquidity zones are where you’ll often see price get "swept" before a significant move. It’s like the big players "testing the waters" or "clearing out" weaker positions before they push the price in their desired direction.
Recognizing Market Structure Shifts
Market structure refers to the pattern of highs and lows that price creates. In an uptrend, you see higher highs and higher lows. In a downtrend, it’s lower highs and lower lows. Smart Money concepts focus on identifying when this structure is likely to change.
- Break of Structure (BOS): When price makes a new high in an uptrend or a new low in a downtrend, it confirms the existing trend. This is what most retail traders see.
- Change of Character (CHOCH) / Market Structure Shift (MSS): This is more subtle. It’s when price breaks a previous low in an uptrend, or a previous high in a downtrend. This signals that the trend might be reversing. For example, if the US100 has been making higher highs and higher lows, but then it breaks below the last significant low, that’s a potential shift. This is a key signal that Smart Money might be changing their position.
Utilizing Fair Value Gaps for Entries
Fair Value Gaps (FVGs), also known as imbalances, are areas on the chart where price moved very quickly in one direction, leaving a void. They represent inefficient price delivery. Smart Money often uses these gaps as targets or entry points.
When price creates an FVG, it means there wasn’t enough opposing interest to balance the trade. Later, price often returns to fill these gaps. For traders using SMC, an FVG can act as a magnet for price. If you see an FVG form after a Market Structure Shift, it can be a strong indication of where price might go next. You’d typically look for price to retrace into the FVG and then continue in the direction of the new structure.
The US100, being a tech-heavy index, often exhibits sharp moves. Understanding where liquidity resides, how market structure breaks can signal reversals, and how price imbalances (FVGs) are filled can help you align your trades with institutional flow, rather than fighting against it. It’s about watching where the big money is likely to be acting.
Common Pitfalls in US100 Trading
Even with a solid strategy, it’s easy to stumble when trading the US100. Many traders, especially those new to the index, fall into predictable traps. Understanding these common mistakes is half the battle in avoiding them and keeping your trading account healthy.
Ignoring Session Timing
The US100, like most major indices, has distinct periods of high activity and relative calm. Trading outside of these key sessions, particularly the New York open and close, often means facing lower liquidity and wider spreads. This can lead to unfavorable entry and exit prices, making it harder to capture profits. The US trading session, from 9:30 AM to 4:00 PM EST, is generally when the most significant price action occurs. Trying to force trades during the Asian session, for example, might just lead to frustration and unnecessary losses.
Copy-Pasting Strategies
What works for one index or asset might not work for another. The US100 has its own unique characteristics, including its sensitivity to tech news and its specific volatility patterns. A strategy that’s effective for the S&P 500 or the Dow Jones Industrial Average might not translate directly to the Nasdaq 100. It’s important to test and adapt strategies specifically for the US100, considering its typical price behavior and the types of news that move it.
Entering Without Confirmation
Impatience is a trader’s enemy. Jumping into a trade just because the price is moving or because you think it’s going to move is a recipe for disaster. Always wait for clear confirmation signals based on your trading plan. This could be a specific candlestick pattern, a break of market structure, or a retest of a key level. Without confirmation, you’re essentially guessing, and the odds are stacked against you.
Risk Management Oversights
This is perhaps the most critical pitfall. Many traders fail to properly manage their risk on each trade. This includes:
- Not defining a stop-loss: Entering a trade without knowing where you’ll exit if the market moves against you is like driving without brakes.
- Risking too much capital: A common recommendation is to risk no more than 0.5% to 1% of your trading capital on any single trade. Exceeding this can quickly deplete your account after a few losing trades.
- Ignoring position sizing: Even with a stop-loss, if your position size is too large, a small price move against you can result in a significant loss.
Proper risk management isn’t about avoiding losses; it’s about controlling them so you can stay in the game long enough to capture winning trades. It’s the bedrock of sustainable trading.
Avoiding these common mistakes requires discipline, patience, and a willingness to learn from both successes and failures. Focus on understanding the US100’s behavior and sticking to a well-defined trading plan.
Many traders stumble when they first start trading the US100. Common mistakes include not understanding the market’s movements or getting caught up in emotional decisions. These pitfalls can lead to losing money quickly. To avoid these traps and trade smarter, check out our expert tips on our website!
Wrapping It Up
So, we’ve looked at how the US100 index can really move, especially during certain times of the day or week, and what happens around big news like company earnings. It’s clear that understanding these patterns, like when volatility tends to spike in the morning or late afternoon, or how earnings reports can shake things up, is pretty important for anyone trading this index. Remember, the market doesn’t always behave the same way, and keeping an eye on these trends can help you make smarter decisions. It’s all about being aware and ready for what might come next.
Frequently Asked Questions
What makes the US100 (Nasdaq 100) move so much?
The Nasdaq 100 is packed with big tech and growth companies. These stocks often react strongly to news about new technology, interest rates, and how well companies are doing. Think of companies like Apple, Microsoft, and Amazon – when they have big news, it can shake up the whole index, causing it to move a lot.
When is the best time to trade the Nasdaq 100?
Trading is often busiest and most exciting right when the market opens (9:30 AM to 10:30 AM ET) and again near the close (3:30 PM to 4:00 PM ET). Mondays and Fridays can also see bigger price swings because traders are reacting to weekend news or getting ready for the week ahead.
What should I watch out for when trading the Nasdaq 100?
You need to be extra careful during big events. Things like company earnings reports, important economic news, or even world events can cause the Nasdaq 100 to jump around unexpectedly. It’s smart to know when these events are happening so you can be prepared.
Are there different ways to trade the Nasdaq 100?
Yes, there are! Some traders try to make many small profits quickly (scalping), others trade within a single day (day trading), and some hold trades for a few days or weeks to catch bigger moves (swing trading). The best method depends on how much time you have and how much risk you’re comfortable with.
What are ‘Smart Money Concepts’ in trading?
Smart Money Concepts are ideas traders use to try and figure out where big players, like banks, might be putting their money. This involves looking for areas where there’s a lot of buying or selling activity, and trying to spot patterns that suggest where the price might go next.
What are common mistakes new traders make with the Nasdaq 100?
Some common mistakes include not paying attention to the best trading times, using the same strategy for everything without checking if it works, jumping into trades without clear signals, and not having a solid plan for managing risk if the trade goes the wrong way.