Trading the US30, Nasdaq (US100), and Gold can be tricky. There’s a lot going on in the markets, and figuring out where prices might go next is tough. This guide is here to help you make sense of it all. We’ll look at how to read price action for US30 and Nasdaq, find gold support and resistance, understand index candlestick patterns, and use momentum trading to your advantage. It’s all about spotting opportunities and managing your risk.
Key Takeaways
- Understanding market trends and key support/resistance levels is the first step for US30, Nasdaq price action, and gold trading.
- Core price action strategies like breakout confirmation and trend following can be applied to indices and commodities.
- Recognizing index candlestick patterns and using indicators like RSI and MACD are important for momentum trading.
- Integrating economic indicators and news events into your analysis helps understand market sentiment, especially for the US30.
- Effective risk management, including position sizing and stop-loss orders, is vital for all traders, particularly in volatile markets.
Understanding Market Dynamics for US30, Nasdaq, and Gold
Before you even think about placing a trade on the US30, Nasdaq (US100), or Gold, you really need to get a handle on what makes these markets tick. They don’t just move randomly, you know. There are underlying forces and patterns that, once you start to see them, can make a big difference in your trading. It’s like learning the rules of a game before you play – you wouldn’t just jump in blind, right?
Identifying Key Support and Resistance Levels
Think of support and resistance levels as invisible floors and ceilings on a price chart. Support is a price level where a downtrend can be expected to pause, find a footing, and then potentially reverse. It’s where buying interest is strong enough to overcome selling pressure. Resistance, on the other hand, is a price level where an uptrend can be expected to pause or reverse. This is where selling pressure becomes strong enough to overcome buying interest.
- Support: A price area where demand is thought to be strong enough to prevent the price from falling further.
- Resistance: A price area where supply is thought to be strong enough to prevent the price from rising further.
These levels aren’t always exact lines; they can be zones. When prices approach these areas, pay close attention. A break through support might signal a continuation of a downtrend, while a break above resistance could mean the start of a new uptrend. It’s about watching how the price reacts when it hits these spots.
Spotting these levels often involves looking at past price action. Where did the price turn around before? Where did it stall out? These historical turning points are your best clues for future support and resistance.
Analyzing Trend Strength with ADX
Knowing if a market is trending strongly or just meandering is pretty important. That’s where the Average Directional Index, or ADX, comes in handy. It’s an indicator that measures the strength of a trend, not its direction. So, a high ADX reading means there’s a strong trend happening, whether it’s up or down. A low ADX, however, suggests the market is range-bound or lacks clear direction.
Here’s a quick look at what ADX values generally suggest:
| ADX Reading | Trend Strength |
|---|---|
| 0-20 | Weak or No Trend |
| 20-25 | Developing Trend |
| 25-50 | Strong Trend |
| 50-75 | Very Strong Trend |
| 75-100 | Extremely Strong Trend |
When the ADX is climbing and is above 25, it’s a good sign that a trend is in play and likely to continue. If it’s falling and below 20, you might want to rethink looking for trend-following trades and perhaps consider range-bound strategies instead.
Leveraging Multiple Timeframe Analysis
Trying to figure out what a market is doing by only looking at a 5-minute chart is like trying to understand a whole movie by watching just one scene. You miss the bigger picture. Multiple timeframe analysis means looking at charts across different time periods – say, the daily chart for the overall trend, the 4-hour chart for confirmation, and the 1-hour chart for entry signals. This approach helps you align your trades with the dominant market direction, increasing your odds of success.
Here’s a common way traders use multiple timeframes:
- Long-Term Chart (e.g., Weekly or Daily): Identify the primary trend. Is the US30 generally moving up, down, or sideways?
- Medium-Term Chart (e.g., 4-Hour or 1-Hour): Confirm the trend identified on the longer timeframe and look for potential pullbacks or consolidation areas.
- Short-Term Chart (e.g., 15-Minute or 5-Minute): Pinpoint precise entry and exit points based on the signals from the higher timeframes.
If your long-term chart shows an uptrend, you’d ideally want to look for buying opportunities on your shorter-term charts, rather than trying to short the market against the prevailing trend. It adds a layer of confirmation and helps filter out weaker trade setups.
Core Price Action Strategies for Indices and Commodities
When you’re looking at markets like the US30, US100, or Gold, sticking to a few solid price action strategies can make a big difference, especially for those focused on day trading. It’s not about having a million different methods, but about mastering a few that work consistently.
Breakout Confirmation Techniques
Breakouts happen when the price moves decisively past a known support or resistance level. The trick is to tell a real breakout from a fake one, often called a ‘false breakout’. We want to see the price not just touch the level and bounce back, but really push through it. A good sign is when the price closes beyond that level on your chart. Another confirmation comes from volume – a breakout on higher-than-usual volume suggests more traders are involved and the move has strength. You also want to see some follow-through in the next few trading periods, not just a quick spike and retreat.
- Look for increased volume during the breakout.
- Confirm with a price close beyond the support/resistance level.
- Watch for continued price movement in the breakout direction.
Trend Following Principles
Trading with the trend is often simpler and more profitable than trying to catch tops and bottoms. Think of it like surfing – you want to ride the wave, not fight it. Identifying the main trend direction is step one. You can use tools like moving averages to help with this. If the price is consistently making higher highs and higher lows, that’s an uptrend. If it’s making lower highs and lower lows, that’s a downtrend. Once you know the trend, you look for entry points that align with it. For example, in an uptrend, you might look to buy on pullbacks to a support level or a moving average.
The market often gives you chances to join a trend after a small pause. Waiting for confirmation that the trend is resuming is usually a safer bet than jumping in too early.
Mean Reversion Opportunities
Mean reversion is the idea that prices tend to move back towards their average over time. This strategy is about looking for those times when the price has moved too far, too fast, away from its average. Indicators like the Relative Strength Index (RSI) can show when an asset is overbought (too high) or oversold (too low). When you see these conditions, especially if the price is hitting extreme levels on, say, Bollinger Bands, it might be a signal that a reversal is coming. You’d then look to trade against the recent short-term move, betting on the price returning to its average.
- Identify overbought/oversold conditions using RSI.
- Look for price extremes near Bollinger Band edges.
- Wait for signs of reversal before entering a trade.
- Target the average price level as a potential profit zone.
Candlestick Patterns and Momentum Trading

Candlesticks are like the heartbeat of the market, showing us not just where the price went, but how it got there. Understanding these patterns can give you a real edge, especially when you combine them with momentum indicators. It’s not just about seeing a green or red candle; it’s about what that candle tells you about the buyers and sellers.
Recognizing Index Candlestick Patterns
Different candlestick patterns can signal potential shifts in market sentiment. For indices like the US30 and US100, patterns like the "Doji" can indicate indecision, while a "Hammer" or "Inverted Hammer" might suggest a potential reversal after a downtrend or uptrend, respectively. The "Engulfing" pattern, where a larger candle completely covers the previous one, is often a strong signal of a trend change. It’s important to look at these patterns in the context of the overall trend and support/resistance levels. A single candlestick pattern is rarely enough; confirmation from other signals is key.
Utilizing RSI for Overbought/Oversold Conditions
The Relative Strength Index (RSI) is a fantastic tool for gauging momentum. It oscillates between 0 and 100, and readings above 70 typically suggest an asset is overbought, meaning it might be due for a pullback. Conversely, readings below 30 suggest it’s oversold and could be due for a bounce. For indices and gold, spotting divergences between the RSI and price action can be particularly insightful. For example, if the price makes a new high but the RSI makes a lower high, that’s a bearish divergence, hinting that the upward momentum is weakening.
Here’s a quick look at RSI levels:
| RSI Level | Condition |
|---|---|
| > 70 | Overbought |
| < 30 | Oversold |
| 30-70 | Neutral |
MACD for Trend Strength and Reversals
The Moving Average Convergence Divergence (MACD) is another workhorse indicator. It helps us see the relationship between two moving averages of prices. When the MACD line crosses above the signal line, it’s often seen as a bullish signal, suggesting upward momentum is building. The opposite, when the MACD line crosses below the signal line, is a bearish signal. Like the RSI, the MACD can also show divergences. If the price is making new highs but the MACD isn’t, it’s a sign that the trend might be losing steam. This can be a good heads-up for potential reversals or at least a pause in the current move. When you see these indicators align with candlestick patterns, you start to build a more robust trading picture. You can find good trading sessions for these instruments, often during the New York trading session.
When analyzing price action, always remember that indicators are tools to help interpret the market, not crystal balls. They work best when used in conjunction with each other and with a solid understanding of support and resistance levels. Don’t rely on just one signal; look for confluence.
Integrating Fundamental Analysis into Trading
Impact of Economic Indicators on US30
When you’re trading the US30, it’s not just about watching the price charts. You’ve got to keep an eye on what’s happening in the broader economy, especially in the US. Think about things like jobs reports, inflation numbers, and interest rate decisions from the Federal Reserve. These big economic events can really shake things up. For instance, a surprisingly strong jobs report might signal a healthy economy, which could push the US30 higher. On the flip side, rising inflation could lead to fears of interest rate hikes, potentially causing the index to drop.
Here’s a quick look at some key indicators:
- Non-Farm Payrolls (NFP): Released monthly, this shows job creation. Big surprises here often cause immediate market moves.
- Consumer Price Index (CPI): This measures inflation. Higher CPI can mean the Fed might raise rates.
- Federal Reserve FOMC Statements: These announcements reveal the Fed’s stance on interest rates and the economy. They’re closely watched for clues about future policy.
Paying attention to these reports can give you a heads-up on potential market direction.
Monitoring Corporate Earnings and News
Since the US30 is made up of 30 major US companies, the performance and news surrounding these individual businesses matter a lot. Earnings season, when companies report their profits and losses, is a particularly busy time. If a big company in the index reports better-than-expected earnings, it can lift the whole US30. Conversely, a disappointing report from a major player can drag it down. It’s not just earnings, though. Any significant news about these companies – like new product launches, mergers, or management changes – can influence their stock price and, by extension, the index.
Keeping tabs on company-specific news helps you understand the underlying health of the index’s components. It’s like looking under the hood to see if the engine is running smoothly.
Geopolitical Events and Market Sentiment
Global events can send ripples through financial markets, and the US30, Nasdaq, and Gold are no exception. Things like political elections, trade disputes between countries, or even international conflicts can create uncertainty. This uncertainty often leads to what traders call ‘market sentiment’ shifting. When sentiment turns negative, investors tend to move away from riskier assets like stocks (which the US30 and Nasdaq represent) and might flock to safer havens like gold. So, staying informed about major global happenings is pretty important for understanding why markets might be moving in a certain direction, even if the immediate economic data doesn’t seem to explain it.
Advanced Techniques for Volatile Markets
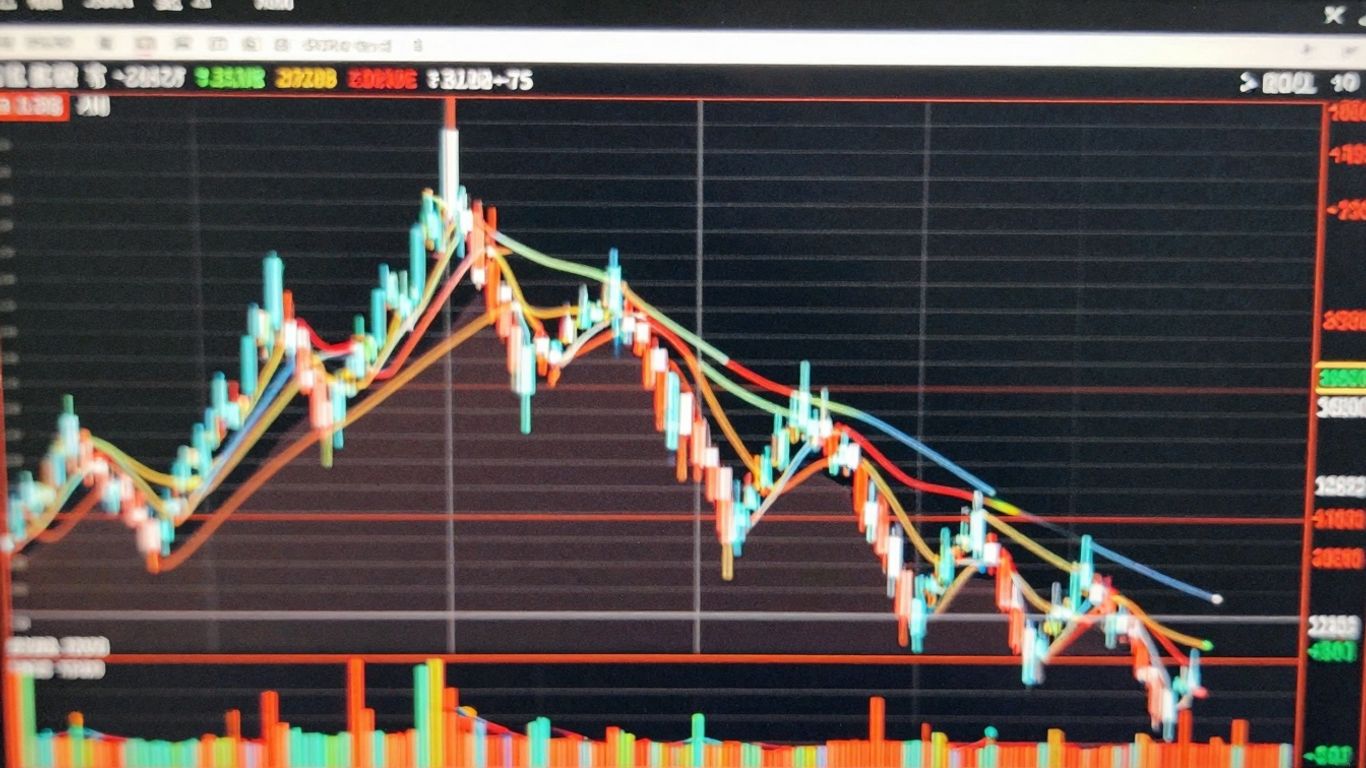
Scalping Strategies for High Liquidity
Scalping is a trading style focused on making many small profits from tiny price changes. It’s best suited for markets with high liquidity, like the US30, especially during peak trading hours. The goal isn’t to catch big moves, but to get in and out quickly, accumulating small gains. Think of it like picking up pennies in front of a steamroller – you need speed and precision.
- Focus on the 1-minute or tick charts: These give you the granular detail needed for split-second decisions.
- Trade during active sessions: When volume is high, spreads are tighter, and price movements are more predictable for short bursts.
- Use tight stop-losses: This is non-negotiable. You’re aiming for small wins, so you must cut losses even smaller.
Scalping requires intense focus and discipline. It’s not for the faint of heart or those who like to sit back and watch the market unfold. You’re in the thick of it, constantly reacting.
News Trading Around Economic Releases
Major economic announcements can send US30, US100, and Gold into a frenzy. This volatility can be an opportunity, but it’s also risky. The key is to have a plan before the news drops.
Here’s a look at some key indicators and their potential impact:
| Indicator | Potential Market Reaction (General) | Notes |
|---|---|---|
| Non-Farm Payrolls (NFP) | Strong USD, Equities Up/Down | High impact on employment and economy |
| Federal Reserve Rate Dec. | Bonds Down, USD Up, Equities Mixed | Signals monetary policy direction |
| GDP Growth Figures | Equities Up, USD Up | Measures overall economic health |
| Consumer Price Index (CPI) | Bonds Down, USD Up, Equities Down | Inflation gauge |
Be prepared for rapid price swings and potential whipsaws. It’s often wise to wait for the initial reaction to settle before entering a trade, or to use very small position sizes if trading directly into the news.
Bollinger Band Squeezes for Volatility
Bollinger Bands are great for spotting periods of low volatility, often called a "squeeze." When the bands tighten significantly, it signals that energy is building up, and a significant price move is likely on the horizon. The direction of the breakout after a squeeze often indicates the start of a new trend.
- Identify the Squeeze: Watch for the upper and lower Bollinger Bands to move very close together. This means the market has been relatively calm.
- Wait for the Breakout: Don’t guess which way the price will go. Wait for a clear candle to close decisively above the upper band or below the lower band.
- Confirm with Volume: Ideally, the breakout should be accompanied by an increase in trading volume, adding conviction to the move.
Essential Risk Management for Traders
Look, trading US30, US100, or gold can be exciting, but if you’re not careful, it can also be a fast way to lose money. That’s where risk management comes in. It’s not the flashy part of trading, but honestly, it’s probably the most important. Without it, even the best strategies can fall apart.
Implementing Proper Position Sizing
This is about figuring out how much of your trading capital to put into any single trade. It’s not about betting the farm. A common guideline is to risk only a small percentage of your total account on any one trade, maybe 1-2%. This means if you have a $10,000 account, you might only be risking $100-$200 per trade. This approach helps you survive losing streaks, which everyone has.
Here’s a simple way to think about it:
- Know your account size: How much money do you actually have to trade with?
- Decide your risk percentage: What’s the maximum you’re willing to lose on one trade (e.g., 1%)?
- Determine your stop-loss distance: How many pips or points away from your entry price will you place your stop?
- Calculate your position size: Use a formula to figure out how many units or contracts you can trade without exceeding your risk percentage.
For example, if you have a $5,000 account and decide to risk 1% ($50) on a trade, and your stop-loss is 50 pips away, you’d calculate the contract size that makes a 50-pip move equal to $50. This is how you keep your losses manageable, no matter what the market throws at you. Getting this right is a big step towards becoming a consistent trader.
Setting Stop-Loss Orders Effectively
Stop-loss orders are your safety net. They automatically close your trade if the price moves against you by a certain amount. It’s like having an emergency exit. You need to place them thoughtfully, not just randomly. Think about where the price might realistically turn around or where your initial trading idea would be invalidated. For indices like the US30, which can move quickly, a well-placed stop is vital. Don’t move your stop-loss further away if a trade is losing; that’s a recipe for disaster.
Adhering to Risk-Reward Ratios
This is about making sure your potential profits are worth the risk you’re taking. A common target is a risk-reward ratio of 1:2 or 1:3. This means for every dollar you risk, you aim to make two or three dollars. So, if you risk $100 on a trade, you’re looking for a potential profit of $200 or $300. This doesn’t mean every trade will hit its target, but over time, if you consistently take trades with good risk-reward potential, you can be profitable even if you don’t win every single trade. It’s a numbers game, and this ratio helps tilt the odds in your favor.
Managing risk isn’t about avoiding losses entirely; it’s about controlling them. Losses are a part of trading, but they shouldn’t cripple your account. By using smart position sizing, well-placed stop-losses, and aiming for favorable risk-reward ratios, you build a trading approach that can withstand the inevitable ups and downs of the market.
Managing risks is super important for anyone trading. It’s like having a safety net to catch you if things go wrong. Learning how to handle risks well can help you keep your money safe and make smarter choices. Want to learn more about how to protect your trades? Visit our website today for tips and tools!
Wrapping It Up
So, we’ve gone over a bunch of stuff about trading US30, US100, and gold using price action. It’s not magic, you know? It takes practice and paying attention to what the charts are telling you. Remember to always keep an eye on the bigger picture, like the overall trend, and don’t forget about managing your money. That’s super important. Don’t get too caught up in trying to catch every single move; sometimes it’s better to just wait for a clear setup. Keep learning, keep practicing, and figure out what works best for you. Happy trading!
Frequently Asked Questions
What are the best times to trade US30, US100, and Gold?
The US30 and US100 markets are most active when the New York stock market is open, usually from 9:30 AM to 4:00 PM EST. Gold can be traded almost 24 hours a day, but often sees more action during the London and New York trading sessions. It’s best to find a time that works for you and stick to it.
How can I tell if a trend is strong?
You can use a tool called the ADX. If the ADX number is higher, like above 25, it means the trend is strong. If it’s lower, below 20, the trend is weak or not really moving much.
What is a ‘breakout’ in trading?
A breakout happens when the price of something, like US30, moves past a price level that it usually stays below or above. Think of it like breaking through a wall. To be sure it’s real, look for more trading activity and see if the price stays past that wall.
How much money should I risk on one trade?
It’s smart to only risk a small part of your total money, like 1% or 2%, on any single trade. This way, if you lose, it won’t hurt your account too much, and you can keep trading.
What are candlestick patterns?
Candlesticks are like little price charts on a bigger chart. Each one shows how the price moved during a certain time. Certain shapes, or patterns, can give clues about what the price might do next, like going up or down.
Why is fundamental analysis important for trading indices and gold?
Fundamental analysis looks at real-world news, like how well companies are doing, what the government is saying about the economy, or big world events. This news can cause big price swings in US30, US100, and gold, so knowing about it helps you understand why the market is moving.