Best Forex Indicators to Use When Trading
April 13, 2022


by Bt Stew
What does the average Forex trader make?
Forex trading is an incredibly profitable venture and side hustle, with the average trader earning about $48,274 every year. Top earners rake in amounts in the millions per year!
However, forex trading isn’t as simple as picking a currency pair and waiting for the money to trickle in. Succeeding in forex trading requires commitment, skill, and experience. Apart from picking the right trading strategies, you also need to know the best forex indicators for successful trades.
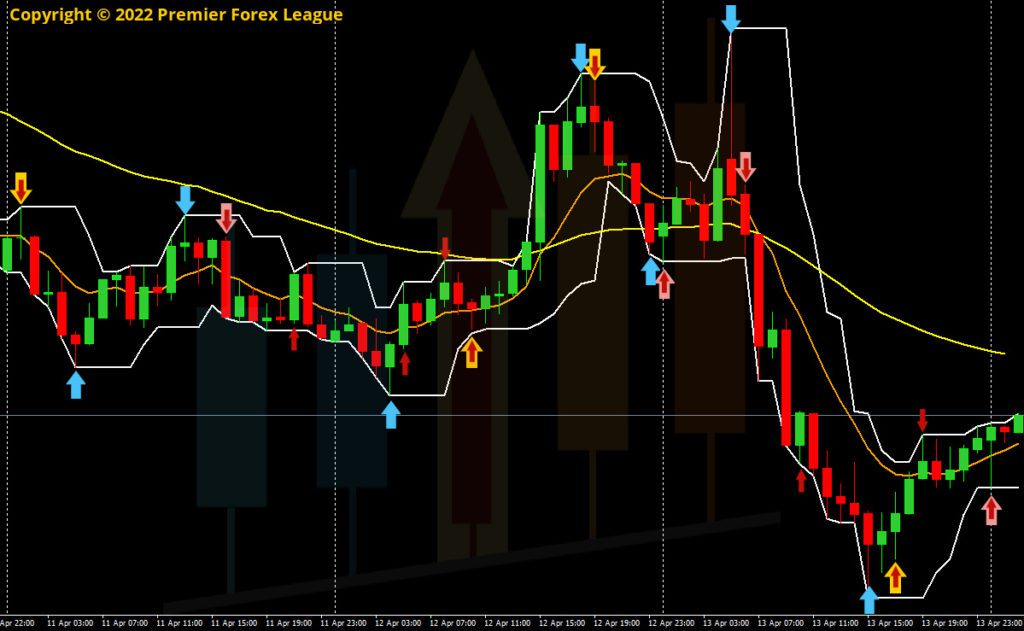
But with so many forex indicators, it’s hard for forex beginners to know which forex indicators convert. If this sounds like you worry not; we’re here to help. Today’s post will discuss a few of the best forex indicators for propitious forex trading.
What Is a Forex Indicator?
A forex indicator is a statistical tool that forex traders use to make informed decisions. There are different forex indicators, from simple ones to extremely complex ones.
The primary goal of using forex indicators is to reduce the risk involved in forex trading. By doing so, forex traders can increase their chances of making successful trades.
Best Forex Indicators for Forex Traders?
Now that you know what a forex indicator is, let’s now look at some of the best indicators you should consider for your trade. If you’re trading forex as a career or side hustle, here are a few indicators to boost your trades.
Relative Strength Index (RSI)
The Relative Strength Index (RSI) is a momentum indicator that measures whether a currency pair is overbought or oversold. It’s also used to identify price reversals.
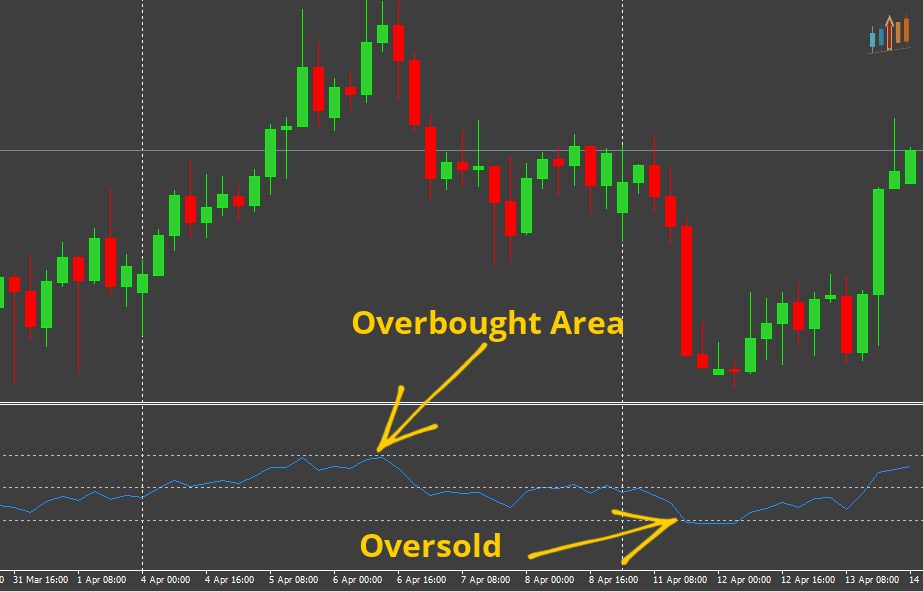
The RSI is calculated using the following formula:
RSI = 100 – [100/(U/D+U)]
U = the number of days the currency pair closes higher than it did the day before
D = the number of days the currency pair closes lower than it did the day before
RSI levels below 30 indicate that a currency pair is oversold, while RSI levels above 70 indicate overbought. Many traders use the RSI with other forex indicators to confirm price reversals.
Moving Average Convergence and Divergence (MACD)
The MACD is among the best metatrader indicators. It consists of two moving averages and an oscillator. The two moving averages are used to identify trend direction, while the oscillator gauges momentum.
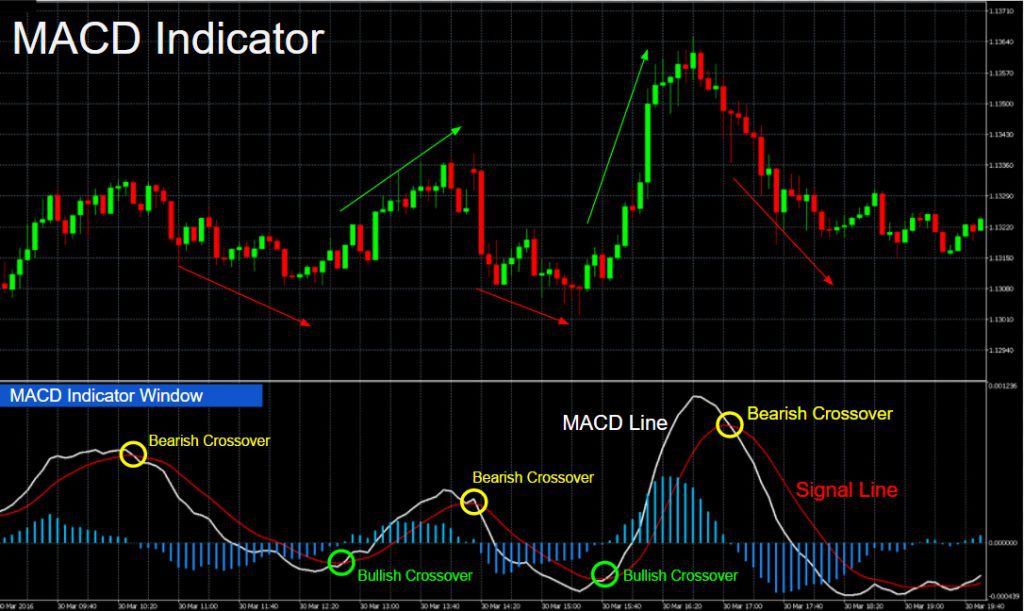
The MACD is calculated using the following formula:
MACD = EMA(12) – EMA(26)
EMA(12) = the 12-period exponential moving average
EMA(26) = the 26-period exponential moving average
The MACD indicator helps traders identify trend direction and momentum. When the MACD line crosses above the signal line, it indicates that the currency pair is on the verge of moving higher.
Similarly, when the MACD line crosses below the signal line, it indicates that the currency pair will move lower.
Hull Moving Indicator
The Hull Moving Average (HMA) is a technical indicator that’s used to identify trends. It’s a faster moving average than the traditional moving average and is thus more responsive to price changes.
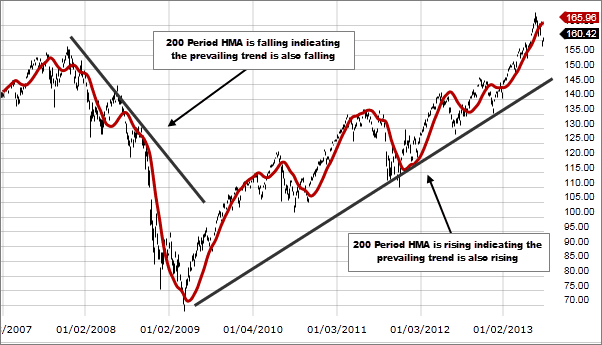
The HMA is calculated using the following formula:
HMA = WMA(n/k)*k+(WMA(n/k))^k
Where:
WMA(n/k) = the n-period weighted moving average of k
k = the square root of n
The Hull Moving Average is an excellent indicator for helping traders identify trends. When the HMA is rising, it indicates that the currency pair is in an uptrend. Similarly, when the HMA is falling, it indicates that the currency pair is in a downtrend.
Supply and Demand Indicator
The supply and demand indicator is a technical indicator used to identify potential support and resistance levels. It’s based on the premise that price movements are caused by the interaction of supply and demand.
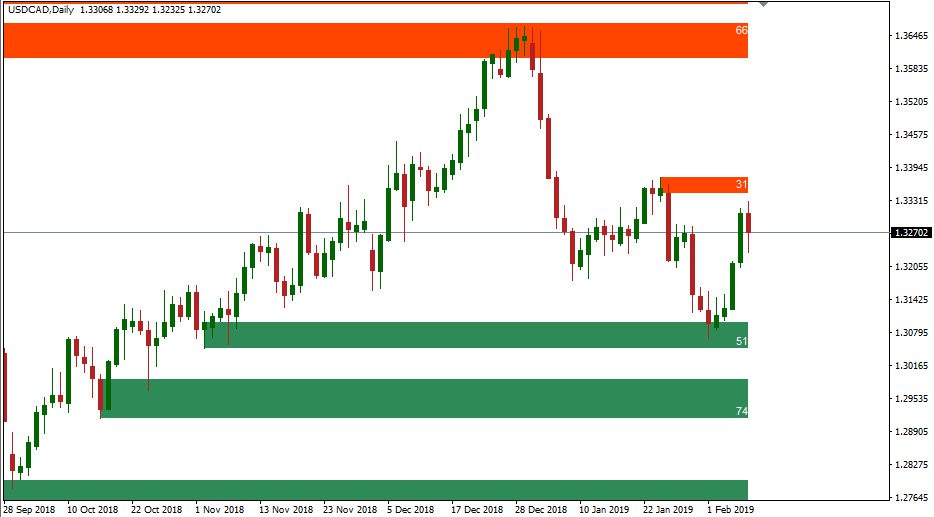
The supply and demand indicator makes traders find profitable trading opportunities. When the indicator is above the price, it means that there’s potential for the currency pair to move higher. Similarly, when the indicator is below the price, it indicates that there’s potential for the currency pair to move lower.
To make use of this forex indicator, traders need to be familiar with support and resistance levels. These are areas where the price is likely to find buyers or sellers.
Bollinger Bands
Bollinger Bands are technical indicators that consist of an upper and lower band. The bands are based on standard deviations from the simple moving average price. This gives an accurate measure of a currency pair’s volatility.
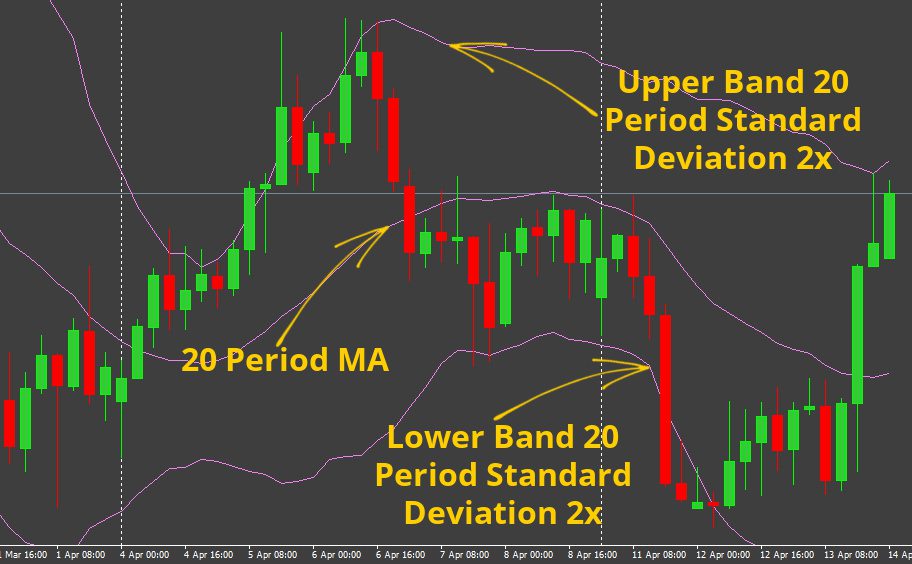
The Bollinger Bands are calculated using the following formula:
Middle Band = 20-period moving average
Upper Band = Middle Band + (20-period standard deviation x 2)
Lower Band = Middle Band – (20-period standard deviation x 2)
The Bollinger Bands are excellent forex indicators because they give clear signals for buying or selling. However, using Bollinger bands can sometimes lead to stop-outs or losses. Forex beginners should tread softly with this indicator.
Trade Exposure
The trade exposure indicator is a technical indicator used to identify potential trade opportunities. It does this by considering the risk and reward of a trade.

The trade exposure indicator is calculated using the following formula:
TEI = [(Probability of Win x Average Win) – (Probability of Loss x Average Loss)] / (Probability of Win x Average Win)
Where:
Probability of Win = the percentage of times the trade has been successful
Average Win = the average profit made on successful trades
Probability of Loss = the percentage of times the trade has been unsuccessful
Average Loss = the average loss incurred on unsuccessful trades
The trade exposure indicator allows traders to assess the risk and reward of a trade before they enter it. This way, they can ensure that the potential rewards outweigh the risks.
Moving Averages
Moving averages are one of the most popular and effective forex indicators. It’s an excellent mt4 trend indicator that helps smooth out price action by filtering out the noise. This makes it easier for traders to identify trends.
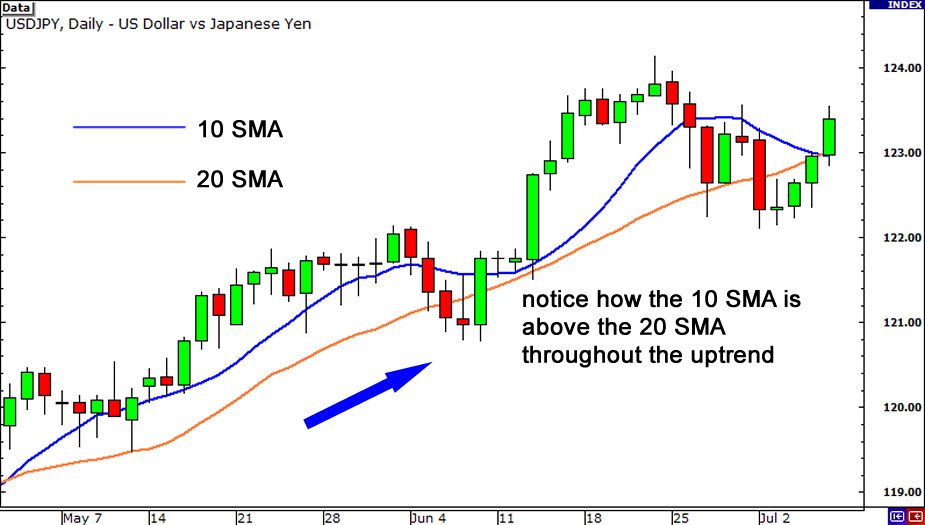
There are different types of moving averages, but the two most common ones are simple moving averages (SMAs) and exponential moving averages (EMAs).
SMAs are calculated by adding up the closing prices of a currency pair over a certain period and then dividing them by the number of periods. EMAs, on the other hand, place more weight on recent data.
Both SMAs and EMAs are effective in identifying trends. However, many traders prefer using EMAs because they’re more responsive to recent price changes.
Average True Range (ATR)
The Average True Range (ATR) is a technical indicator that measures volatility. Traders use it to gauge how volatile a currency pair is and whether it’s worth trading.
The ATR is calculated using the following formula:
ATR = [(H-L)/(H+L)]*P
H = the highest price of the day
L = the lowest price of the day
P = the previous ATR
The ATR is another excellent forex indicator because it helps traders determine the viability of a currency pair. If the ATR is high, it means that the currency pair is volatile, and there’s a potential for big profits.
However, if the ATR is low, it means that the currency pair isn’t worth trading because there’s little potential for profit.
Fibonacci Retracements
Fibonacci Retracements are technical indicators used to identify potential support and resistance levels. They’re based on the Fibonacci sequence, which is a series of numbers where each number is the sum of the two previous numbers.
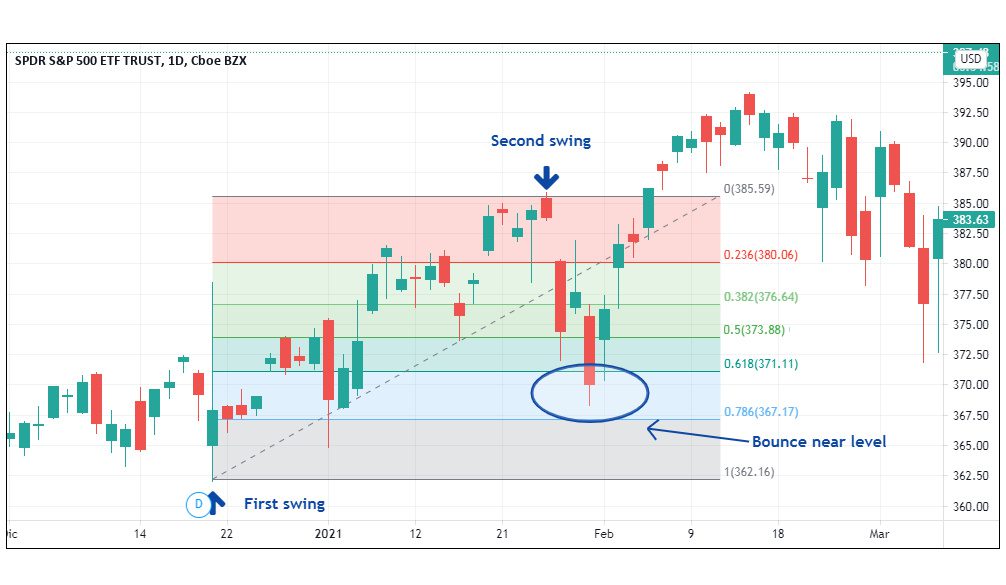
The most common Fibonacci Retracement levels are 23.60%, 38.20%, 50.00%, 61.80%, and 100.00%. Fibonacci Retracements are useful forex indicators because they allow easy take profits. They achieve this by identifying the retracement levels so that traders can enter or exit trades accordingly.
Ichimoku Kinko Hyo
Ichimoku Kinko Hyo is a technical indicator that consists of five lines. The indicator is used to identify trend direction and momentum. The five lines are:
Tenkan-Sen: This line is the sum of the highest high and the lowest low over the past nine periods, divided by two.
Kijun-Sen: This line is the sum of the highest high and the lowest low over the past 26 periods, divided by two.
Chikou Span: This line is the most recent closing price plotted 26 periods behind.
Senkou Span A: This line is the Tenkan-Sen line plotted 26 periods ahead.
Senkou Span B: This line is the Kijun-Sen line plotted 26 periods ahead.
The Ichimoku Kinko Hyo indicator is an incredible forex indicator. However, it may be a tad difficult to grasp its concept. Still, many pro traders laud this indicator for having the right elements for building a complete trading strategy.
Parabolic SAR
Parabolic SAR is a technical indicator that consists of dots. The dots are placed either above or below the price, depending on the direction of the trend.
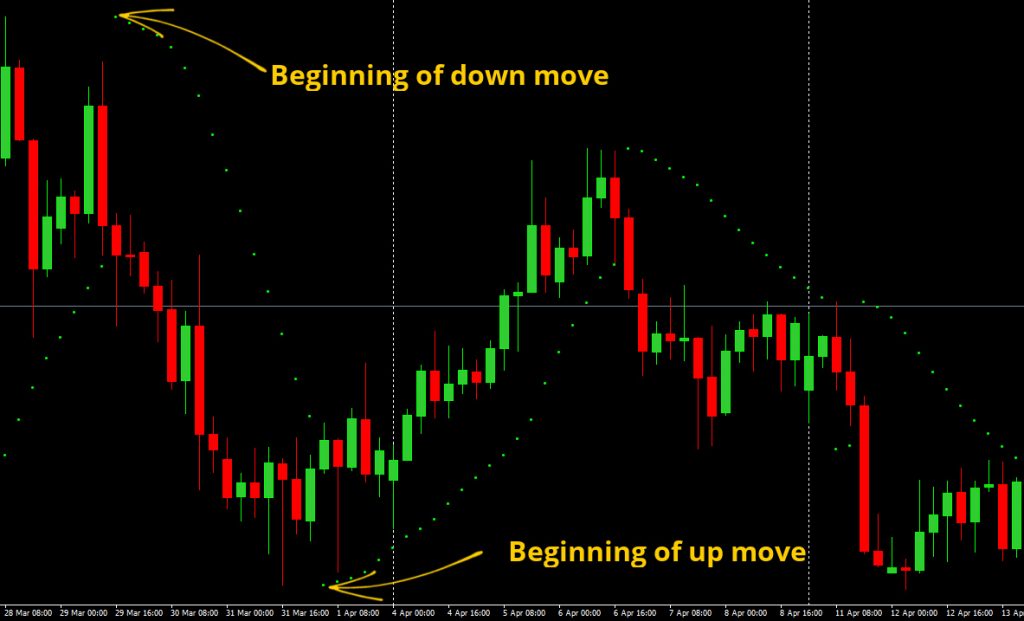
Parabolic SAR is calculated using the following formula:
SAR = Prior SAR + AF(EP – Prior SAR)
EP = Extreme Point
AF = Acceleration Factor
Parabolic SAR is a great forex indicator because it’s easy to use and understand. It can be used in any time frame and with any currency pair. This indicator is especially useful for traders who are just starting out.
After experimenting with individual indicators, you can always combine them to identify more powerful setups. The below example combines Parabolic SAR with a Fibonacci Retracement Indicator.
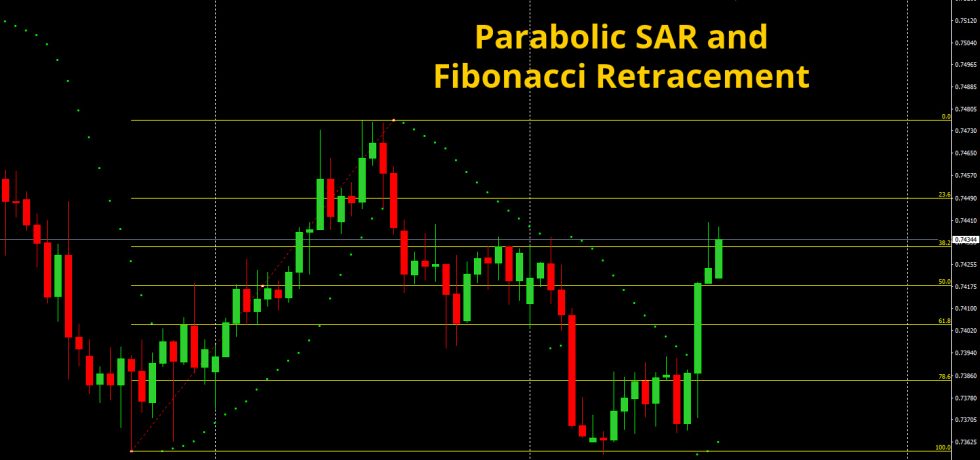
As you can see, there were several trading opportunities along the Fibonacci retracement levels.
Refine Your Forex Trading with the Best Forex Indicators
There you have it! These are just a few of the best forex indicators for successful trades. Remember, don’t put all your eggs in one basket. The best way to increase your chances of success is to use a combination of different indicators.
Contact us or join us today to gain instant access to the best forex signals for successful trades.
Amazing
In early 2015 I was searching for a second income, an extra wage to help pay the bills. I’d had a go at MLM but found all the extra work time consuming. I started looking into binary options and in doing some research I came across a BOTS review. Straight away I was impressed but wanted to do some more research and over the next couple of weeks I found myself drawn to the site on a few occasions and in May 2015 I decided to give it a go. Read more...

Jasfran
Master Trader
$97.00
2 Week Trial then renews at $194/mo.
Everything Included! Complete Access to All Services
Delicious
I found this class by accident. I was already doing some forex and binary when I found MT’s site. Getting texts when to buy and when to sell from the other service I was using was a complete joke. I couldn’t stand the waiting and wondering if we were getting a text or not. It always made me wonder where they are getting the signals. How did they know this and why wasn't it more consistent. One thing for sure they did put a lot of hype to get you to join.
Then I found a video of MT’s session. Read more...

BR
Master Trader

11320 State Route 9, Champlain, NY 12919
1-518-531-8698
info@forexsignalroom.com
Live - 8:30 am - 5:00 pm EST Mon-Fri
January
Monday
January
01
1999
Subscribe below for promotional offers & events
